Description
Today, I decided to speak about how create a dashboard VMDK Latency for vRealize Operation Manager 7. You’ll can be able to look at how make View, link view with another widget.
Create View
First, we need create a view for VMDK informations Latency.
- Go to Dashboard and Click on Views
- Click on Add new View “+”
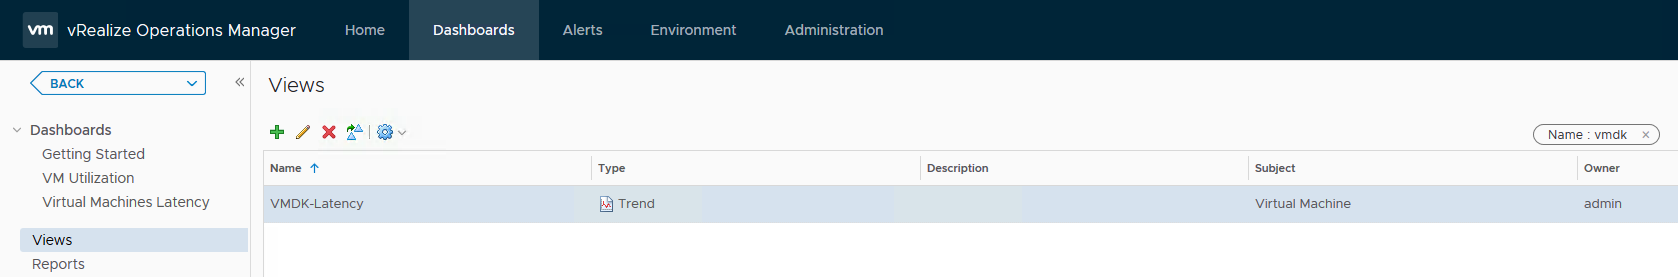
- Type Name and description
- Set “Trend” as presentation
- Choose “Virtual Machine” in subjet section
- In Data Section, Choose “Read Latency” and “Write Latency”in Virtual Disk sub-section. My choice was to see all latency in same View. In Data’s section, you can set Timer Setting as well.
Create Dashboard with VMDK Latency and Virtual Machines
Now, You can create a new Dashboard.
- Got to Dashboard > Actions > Create Dashboard
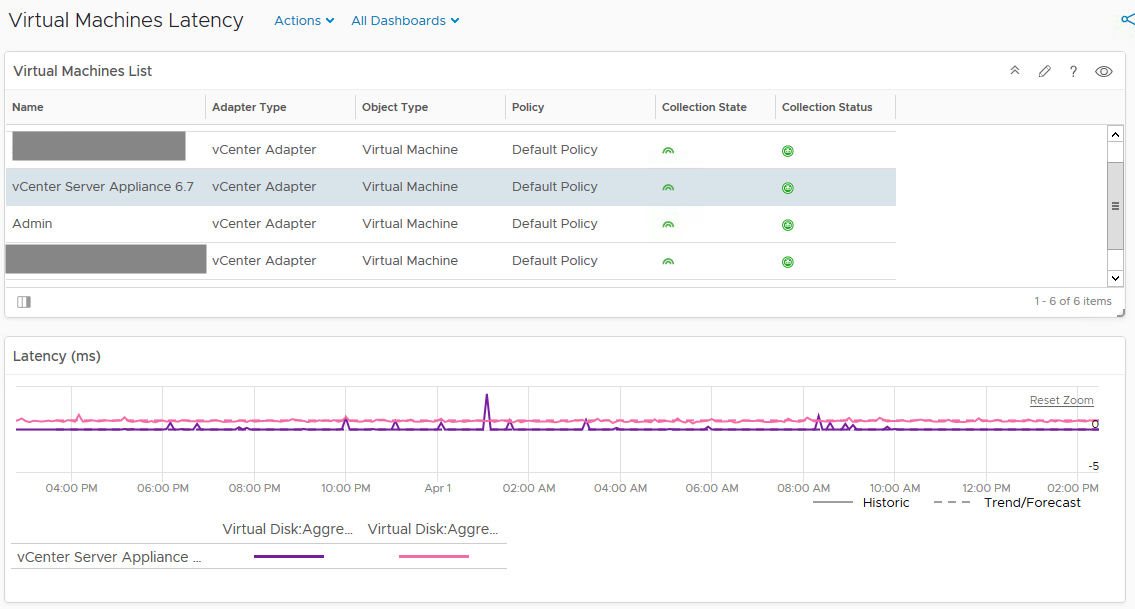
- Change Name – I named it “Virtual machines Latency”
- Add Two widgets – One (Object List) with the list of all virtual machines, and one for metrics View VMDK (View)
Widget – Object List
- Change Name – I named it “Virtual machines List”
- In “Select which tags to filter”, I selected a Virtual machines Folder.
Widget – View
- Change Name – I named it “Latency (ms)”
- Link with your VMDK View. Choose it in the list of view available
Create relationship
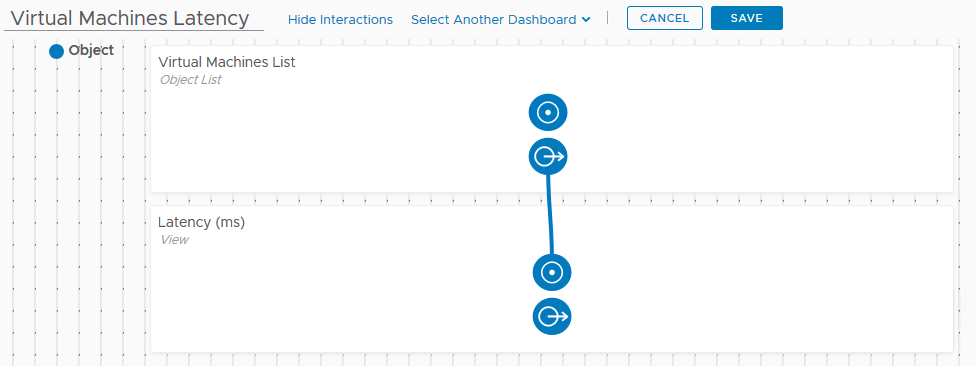
- Edit your Dashboard and click on “Show Interactions”. In this section you can add interaction between differente View. In our case, we would like to show latency when we click on a virtual machine.
Conclusion
So now, when you click on on of your Virtual Machines, you can see informations VMDK Latency.
Have Fun !!